Enable logging on ELK for a brand.
Brief
Details about what ELK does in our system can be read here. In this document we will be looking at how to actually setup and enable the said loggers.
Throughout the example we will consider as the logging is being enabled for the Tatasky in production environment.
Pre-Requisites
- Admin access to ELK.
- (Optional) Admin access to AWS.
Types of loggers
Filebeat
Overview
Filebeat enables to ship raw/unformatted logs from servers to the ELK stack. In terms of ELK, this provides data for the [RAW] dashboards.
- PROS:
- It's not dependent on the process it self rather it depends on a filebeat service running directly on the servers.
- Provides instantaneous raw logs.
- CONS:
- Doesn't support aggregation.
- Doesn't allow field based search.
Initializing
Enabling the service
Ensure that the ELK server's security group, sg-029d67b902031ab59 has a rule allowing incoming connection on port 9200 from the source servers.
- The type of incoming address will be the public IP of the source servers if the source servers are connecting to ELK with public IPs.
- The type of incoming address will be the security group of the incoming servers it the source servers are connecting to ELK with private IPs.
Copy the logging directory from an existing brand to the respective location for the new branch for which logging needs to be enabled. This contains the following files:
filebeatU.yml: This is the main configuration file to enables filebeat. Brand name will have to edited as required, along with that few important fields to keep in mind:
- output.elasticsearch.index: To be updated with new brand name.
- output.elasticsearch.hosts To be updated according the VPC. As a general rule of thumb, only the servers in the oriserve-vodafone can connect with the private IP, servers in any other vpc will have to connect with public IP.
- type: logs : Under this only enable the type of logs for the servers your enabling it for. Example, enable usersLogs & schedulerLogs when enabling for Utility Server.
- S3 location will also vary, for example when enabling on Database Server, the logging folder will be copied to the Database directory and will have only mongoLogs enabled
setupFilebeat.sh: This is used to install and setup filebeat as required on the servers. Only the location to fetch the filebeatU.yml from S3 needs to be edited.
If the servers is of auto-scaling type, this shell script needs to be added in the respective Launch Template.
Otherwise, copy the script to
/tmpand execute it. This will start and enable the filebeat service on the server, now you can check ELK if you've started receiving the logs.cd /tmp
aws s3 cp s3://oriserve-demos/tatasky/AppTier/Environment/Production/logging/setupFilebeat.sh ./
chmod 777 ./setupFilebeat.sh
sudo sh setupFilebeat.sh

Creating searches and dashboard on ELK
- After enabling/starting the service you should be able to see the new index created under Stack Management --> Index Management in ELK. If you don't see please verify the above steps are done. Most importantly re-verify that the security group is correctly configured.
- Index name will be in the format
brandName-env-date-00001. 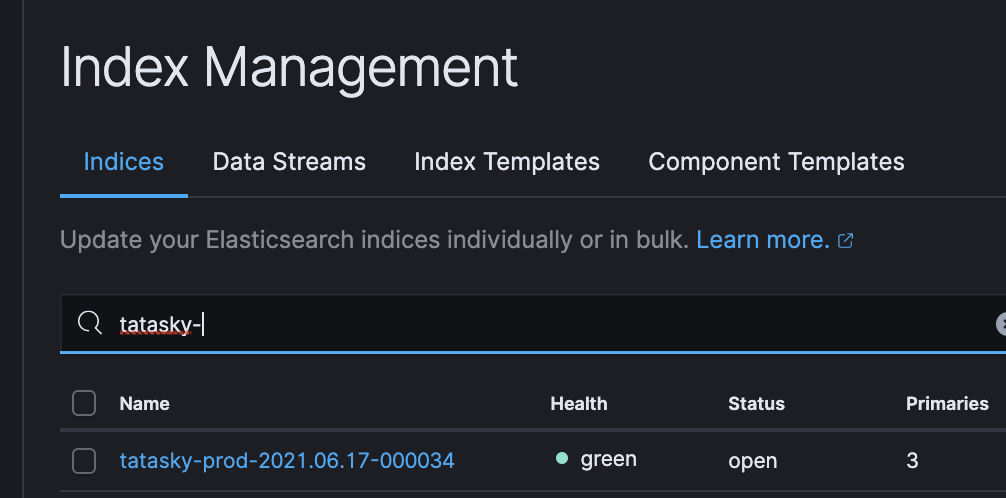
- Once index is confirmed, head over to Jenkins.
- Trigger the job create_raw_dashboard with build parameters described below:
- brand_name: All lowercase brand name.
- env: All lowercase environment.
- Allowed values are
dev&prod.
- Allowed values are
- index name: Index alias created by filebeat, general format is
brandName_env-*. 
- Trigger the job create_raw_dashboard with build parameters described below:
- That's it, if the job runs with no errors it will create all the required saved searches and the [RAW] dashboard for the brand.
Elastic-Logger
Overview
Elastic-Logger use the elastic-logger library to parse and ship logs in neat JSON format. In terms of ELK, this provides the data for the [Deep Insights] dashboards.
- PROS:
- It supports aggregation and field based search.
- It includes, api and access logs with processing time and response code.
- CONS:
- It depends on the process, for example if the OCS process crashes, logs won't be shipped.
Initializing
Enabling the package
- Ensure that the ELK server's security group, sg-029d67b902031ab59 has a rule allowing incoming connection on port 9200 from the source servers.
- The type of incoming address will be the public IP of the source servers if the source servers are connecting to ELK with public IPs.
- The type of incoming address will be the security group of the incoming servers it the source servers are connecting to ELK with private IPs.
- Update the .env file to enable the elastic-logger.
- Deploy or restart the process.
Creating searches and dashboard on ELK
- After enabling the elastic-logger .via the .env file, make sure of the following under Stack Management in ELK:
- A new Index should've been created with some initial docs.
- Index name will be the of following format
env_brandName$$-000001 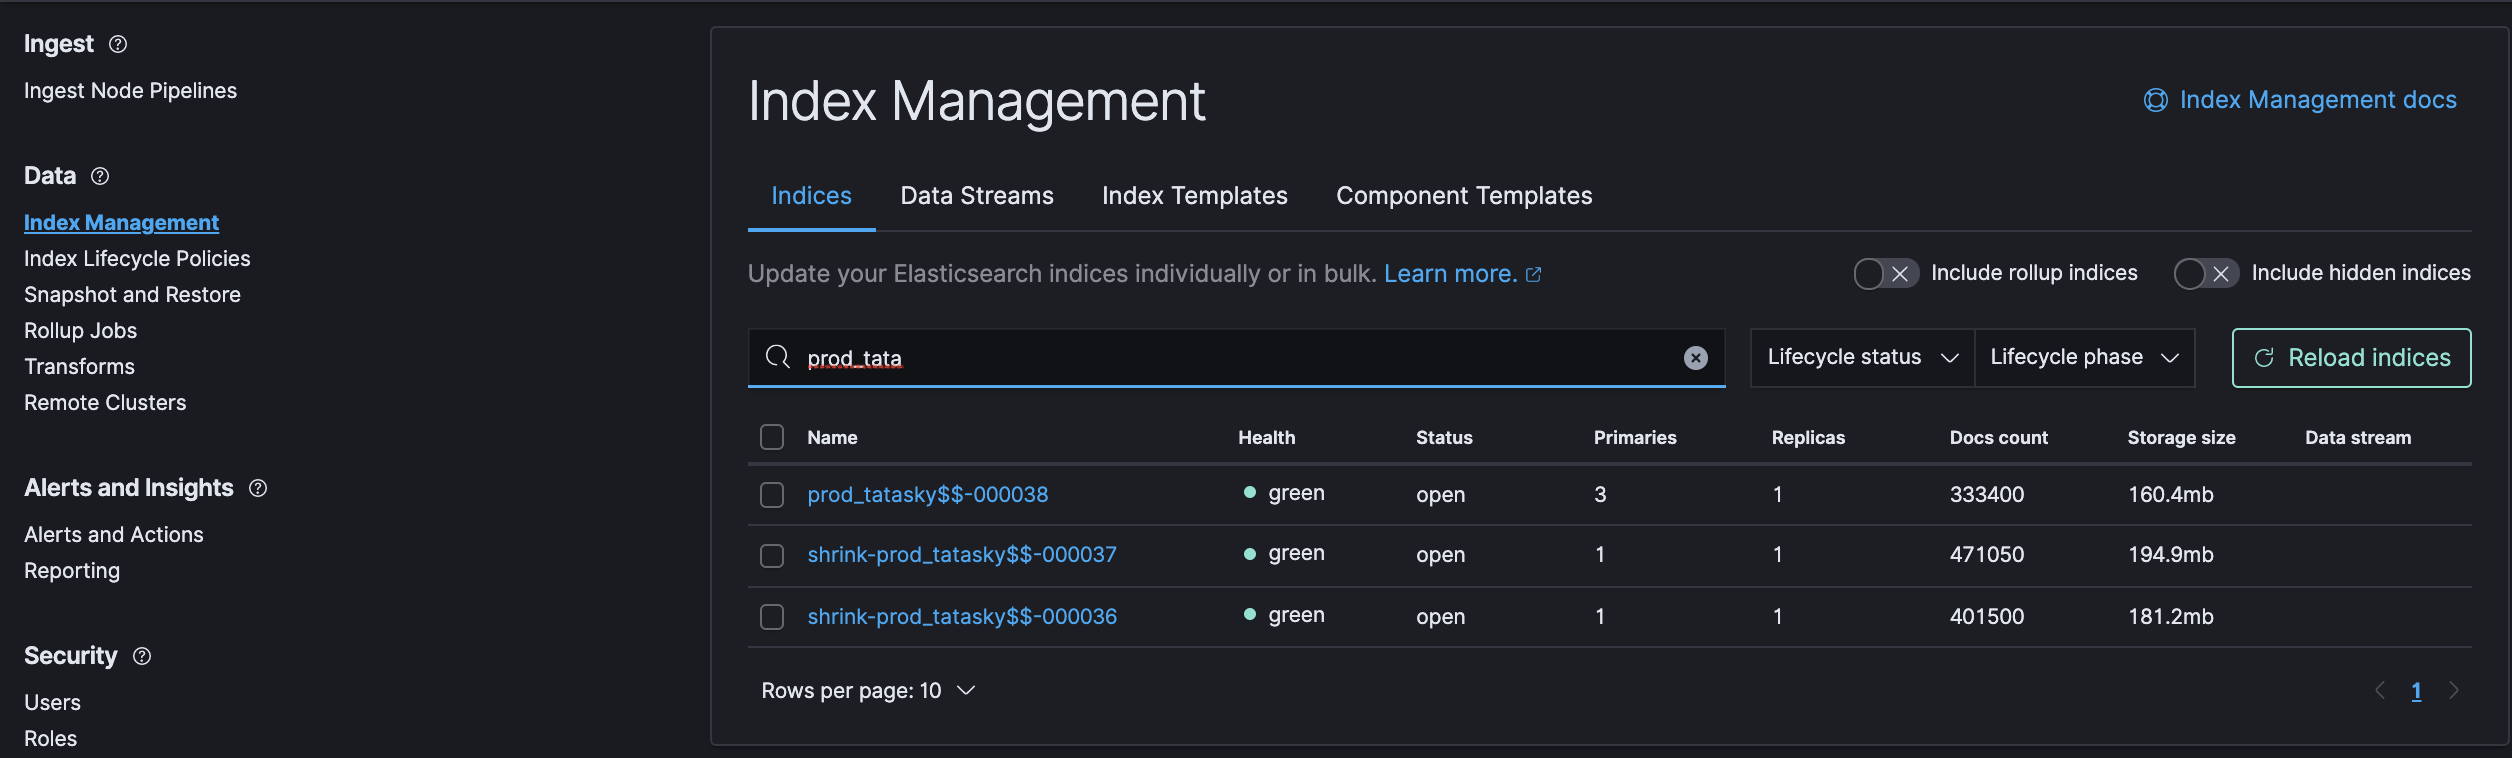
- Index name will be the of following format
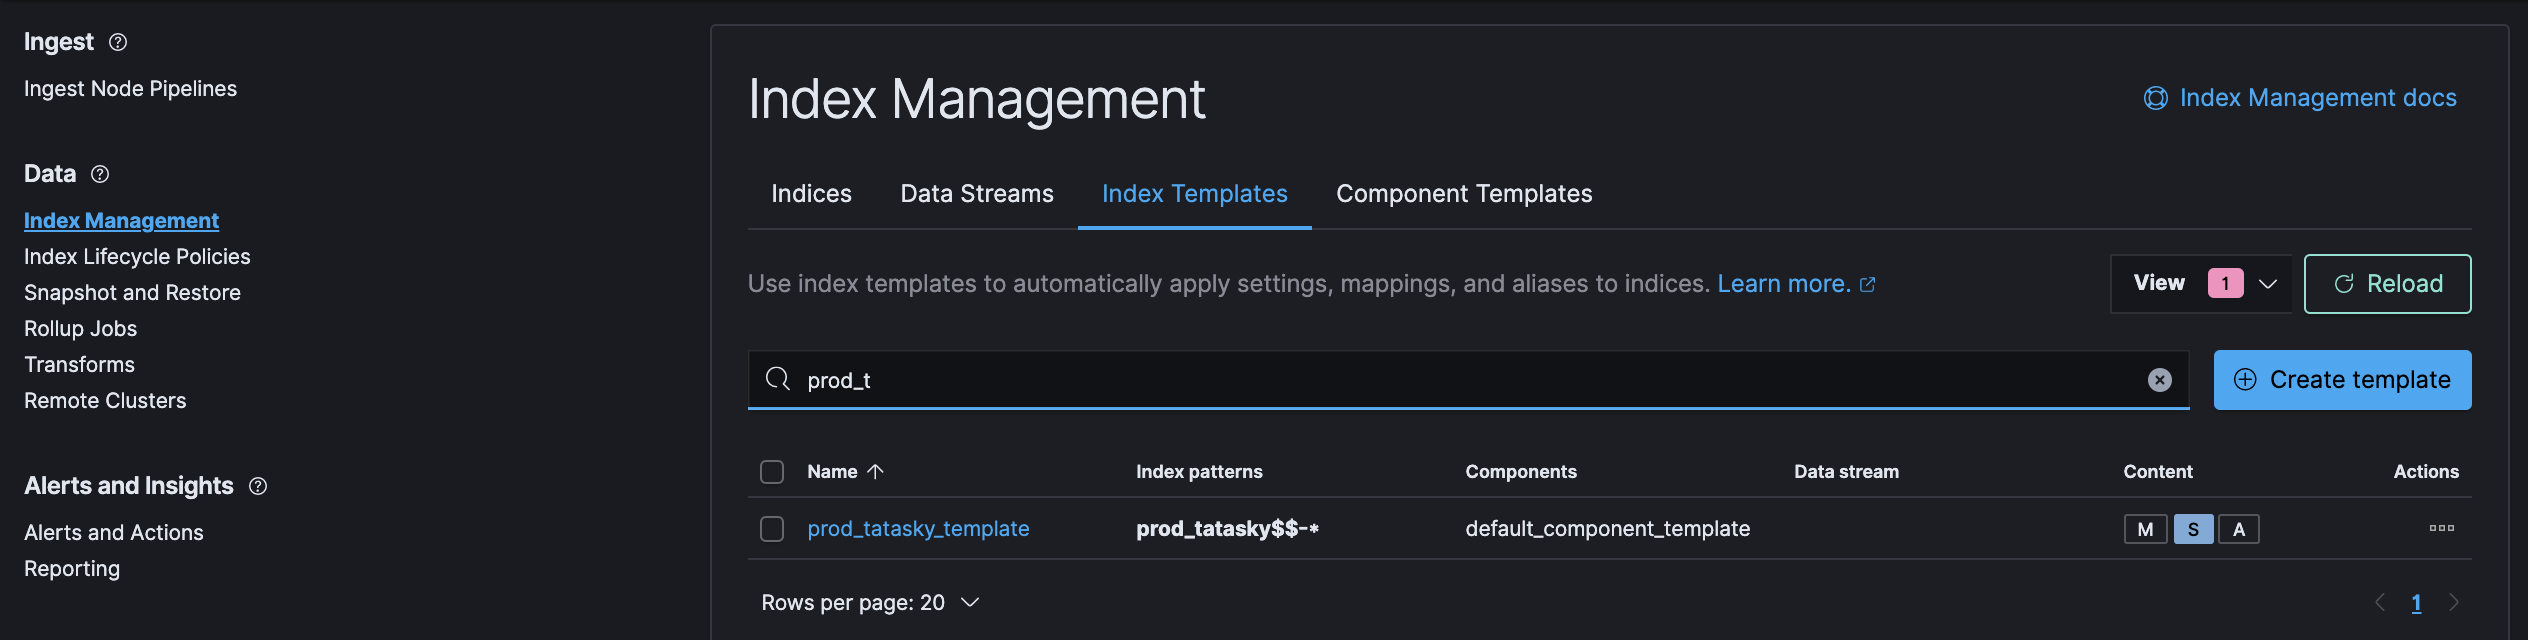
- A new Index Template should've been created.
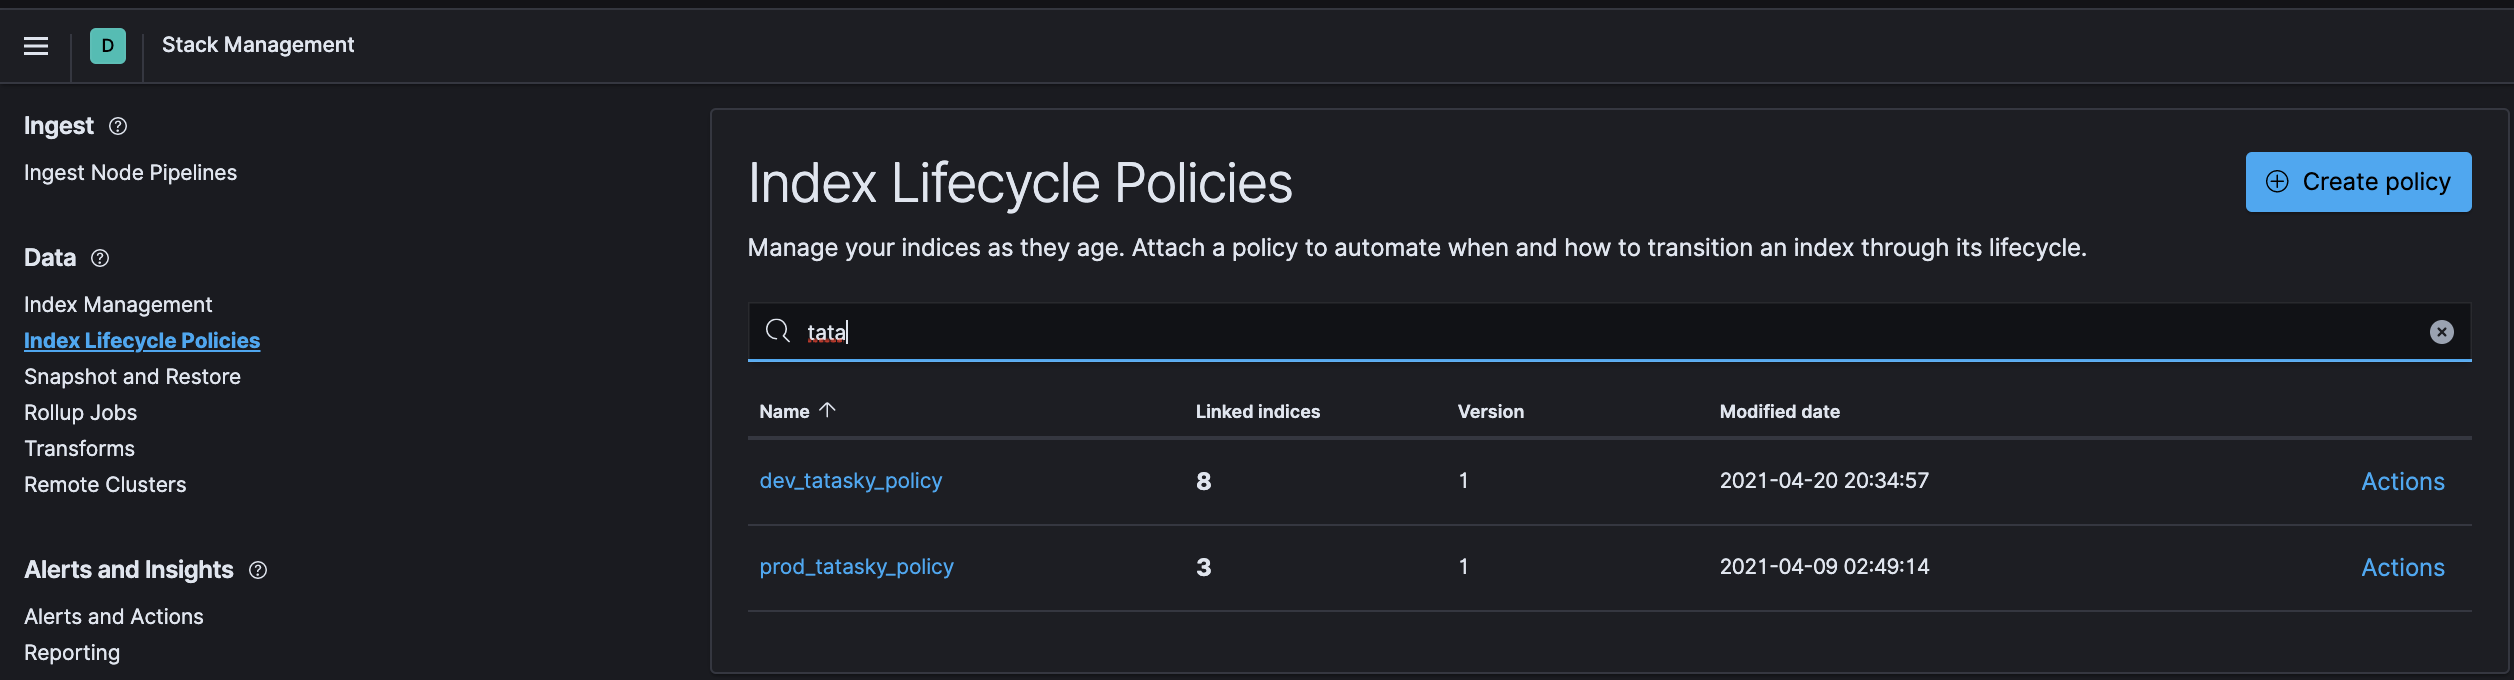
- A new ILM Policy should've been created.
- A new Index Pattern should've been created.
- Index pattern will be in format
env_brandName$$* 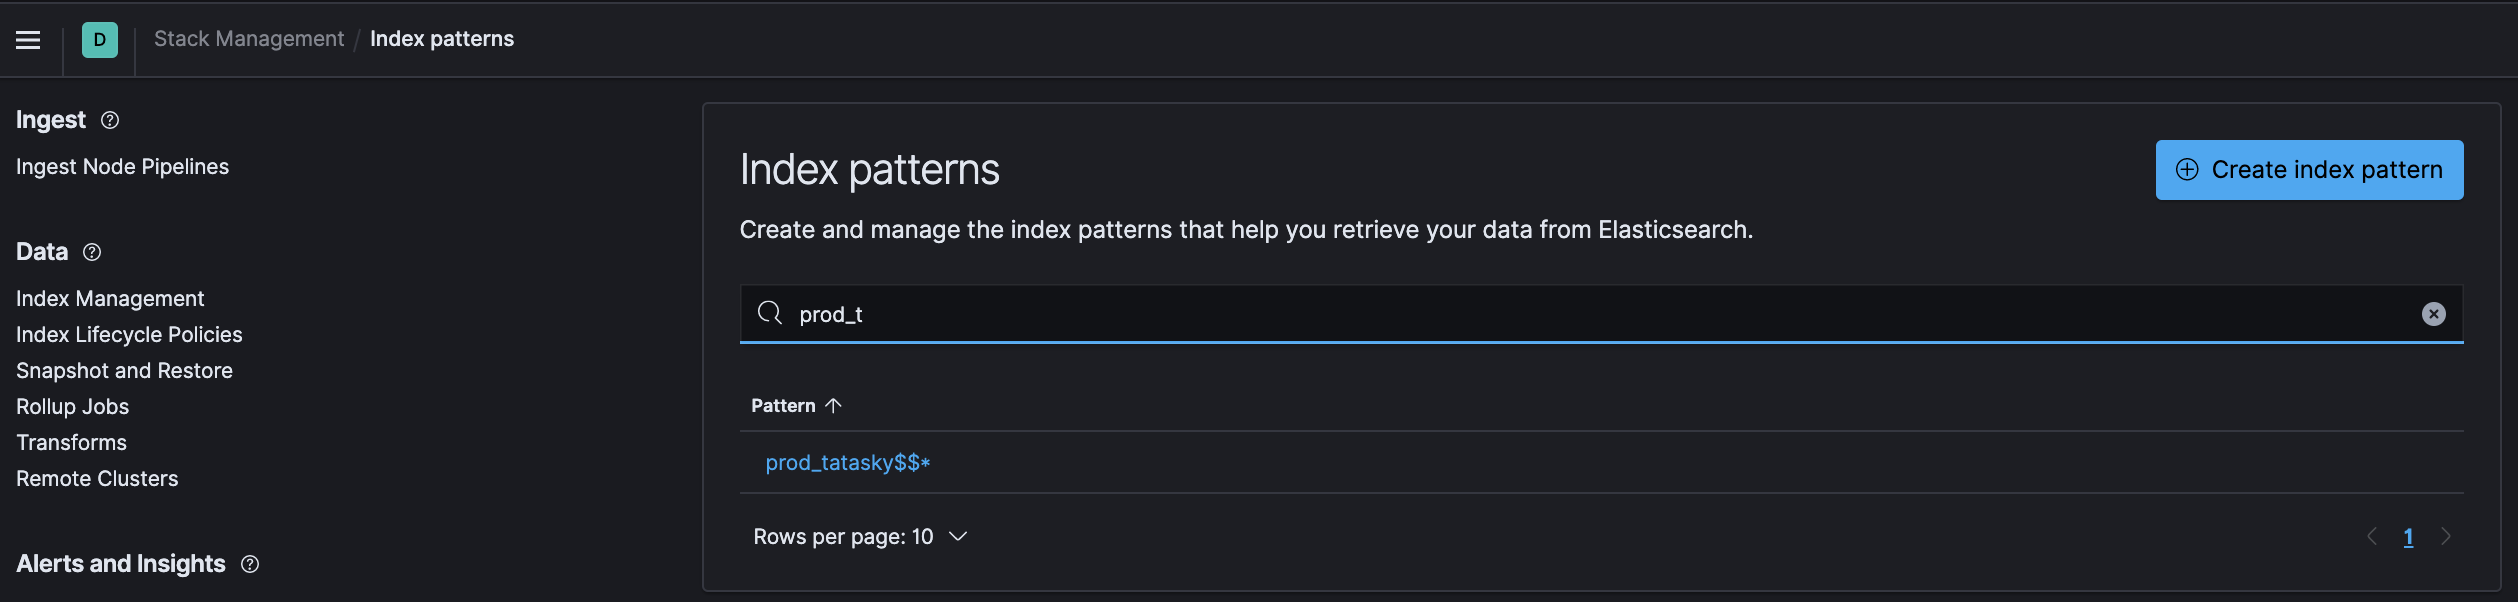
- Index pattern will be in format
- A new Index should've been created with some initial docs.
- If any of the above isn't created on deployment/restart, you'll need to check the console.log for errors and take action accordingly.
- Ensure connection from the source server to ELK server can be established either .via curl or telnet. If it gives an timeout, it's probably an issue with misconfigured security group.
- If everything is created as expected, head over to Jenkins.
- Trigger the job create_deep_insight_dashboard with build parameters described below:
- brand_name: All lowercase brand name.
- env: Select from the dropdown.
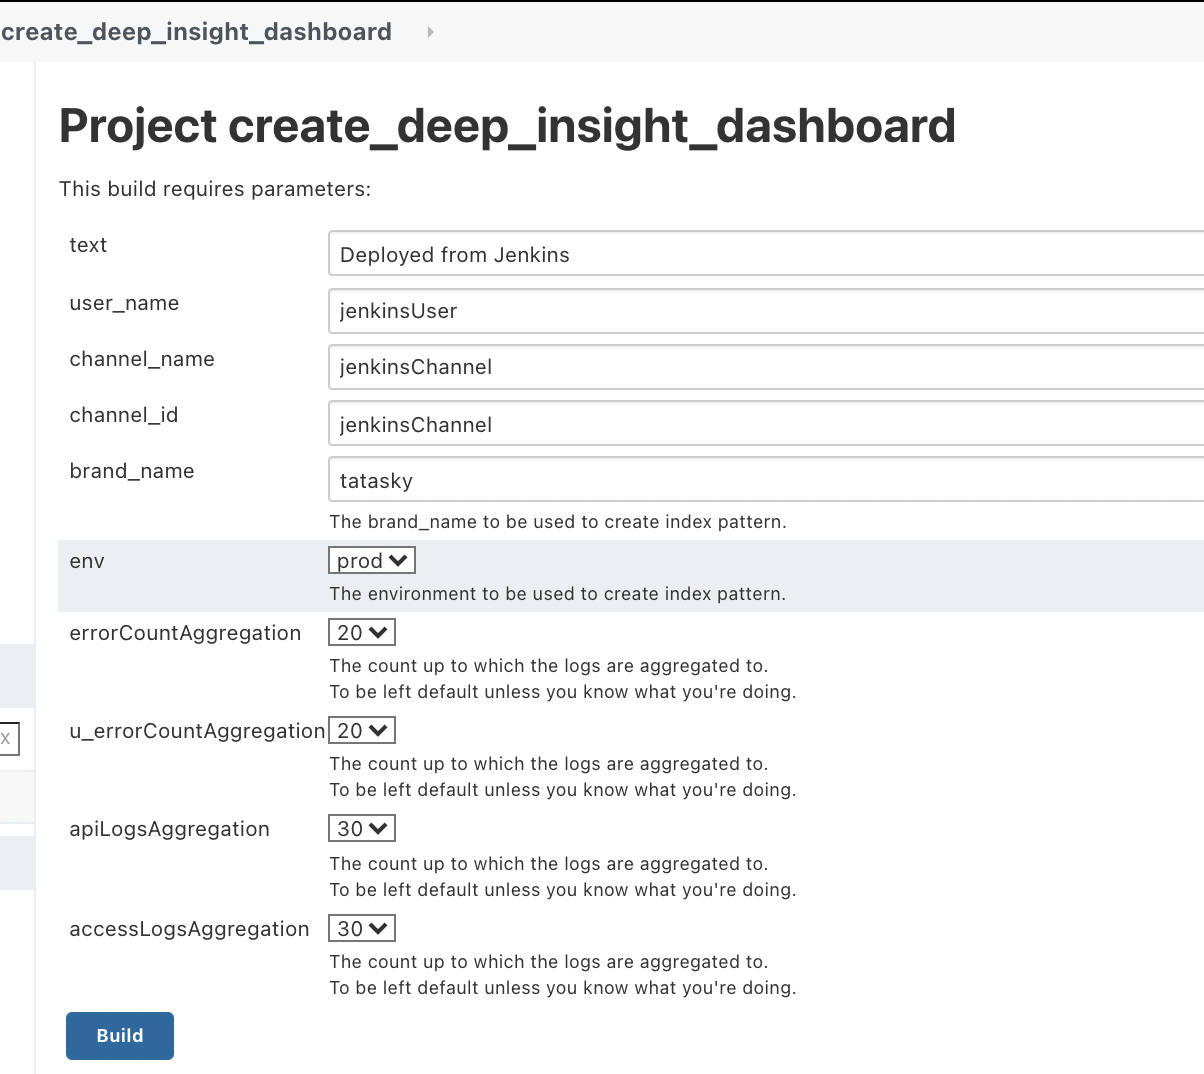
- That's it, if the job runs with no errors it will create all the required saved searches and the [DEEP INSIGHT] dashboard for the brand.